Measuring a Claude Code rollout: the baseline window, the day-30 readout and a clean close
I measure a Claude Code rollout at three points. Before the pilot I collect a baseline window, because every later improvement is measured against it. After 30 days I show the result to the sponsor who decides on scale. At the close the client's team takes over the configuration and maintains it without me.

Claude Code telemetry starts counting on the day the team gets access. It does not see the weeks before the start. So you have to collect the reference point yourself: from the repository, from CI and from a short survey. Below is how I do it: what I collect before the pilot, what I measure during it, what I show after a month and what I leave with the client.
I hold the Claude Partner Badge, Claude Code, issued by Anthropic. Its eight courses cover the stages of a client engagement, and telemetry configs are among the deliverables. The path ends with a scenario-based capstone. The badge is not an exam and not a partnership. I described separately which rollout stages that path covers and what it does not prove.
Why the baseline window comes before the pilot
Every improvement you show the board is a comparison with the state before the pilot. A 20% drop in PR cycle time needs the number you take those 20% from. Without it you also cannot say how many hours the team got back. You cannot rebuild the pre-pilot state from the team's memory. Without it you compare a measurement with an impression.
An impression can point the wrong way. METR ran a randomized study on data from February to June 2025. 16 experienced open-source developers completed 246 tasks in their own repositories. On tasks where AI tools were allowed, they took 19% longer. Before the study they expected AI to speed them up by 24%, and after it they still believed AI had sped them up by 20%. METR calls the result a snapshot of early-2025 AI in one setting. It does not tell you how your team will do.
In February 2026 METR described a second measurement and called it an unreliable signal. More and more developers declined to take part because they did not want to work without AI. Based on conversations with participants, METR thinks it likely that AI speeds them up more now than a year earlier. It calls its own data, however, very weak evidence of how large that change is. I show a chart of both METR measurements with their confidence intervals in the piece about how I work with agents.
One rule follows for a rollout: the team's impression does not replace a measurement, and a measurement without a reference point tells you nothing. Once you have both numbers, the conversation about return gets shorter. I wrote earlier about how to talk to a CFO about a portfolio of metrics instead of a single ROI figure.
What to collect before the pilot, and for how long
Most delivery data already sits in your Git, CI and ticketing history. You can compute those numbers backwards, even if nobody has tracked them so far. You cannot run a survey backwards. That is why I send it before the team gets its first licence.
| Metric | Definition | Source |
|---|---|---|
| Change lead time (DORA) | From a commit in version control to deployment in production. | Git and the deployment pipeline |
| Deployment frequency (DORA) | The number of deployments in a period, or the time between them. | Deployment pipeline |
| Change fail rate (DORA) | The share of deployments that need immediate intervention, such as a rollback or a hotfix. | Incidents and rollbacks |
| PR cycle time | From opening a PR to merging it, with time to first review kept separately. | Git platform |
| Team survey | Five questions about concrete tasks from the past week. | A form before the start |
| Cost baseline | Current tool licences and the team's hours on the tasks the pilot will cover. | Invoices and time tracking |
The first three rows are DORA definitions. I add PR cycle time and the survey myself, because that is where I expect the first changes. I make the baseline window at least as long as the pilot. For a 30-day pilot that means four to six weeks of history. A shorter window catches noise, such as a week with a big release or half the team on holiday.
You can compare only while the group and the definitions stay the same. I measure the same people on the same repositories. DORA advises applying its metrics to one application or service at a time and warns against blending teams. It also warns about Goodhart's law. Announce a metric as a target, and the team will learn to push it up.
I build the survey around concrete tasks. In May 2026 METR published a survey of 349 technical workers, run from February to April. METR's sense is that respondents often think in terms of speed, and it expects speed changes to typically overstate changes in the value of work. It also pointed out that in its 2025 study people overestimated AI's effect on their task time by 40 percentage points on average. So I ask about things that can be checked: how many tasks waited for review, what the team keeps putting off and where it loses time.
The cost baseline has two parts: today's spend and a forecast. Anthropic's documentation gives an average from enterprise deployments. It is around $13 per developer per active day and $150 to $250 per developer per month. The same page advises starting with a small pilot group and establishing your own baseline before a wider rollout. A market average does not replace yours.
What to measure during the pilot
Claude Code exports metrics and events through OpenTelemetry. You turn it on with CLAUDE_CODE_ENABLE_TELEMETRY=1 and choose the exporters. In a pilot I set this in managed settings, the policy file deployed to the pilot group's machines. The whole group then sends data to one collector. A repository cannot turn telemetry on, because Claude Code ignores these variables in project settings.
{
  "env": {
    "CLAUDE_CODE_ENABLE_TELEMETRY": "1",
    "OTEL_METRICS_EXPORTER": "otlp",
    "OTEL_LOGS_EXPORTER": "otlp",
    "OTEL_EXPORTER_OTLP_PROTOCOL": "grpc",
    "OTEL_EXPORTER_OTLP_ENDPOINT": "http://collector.example.com:4317",
    "OTEL_RESOURCE_ATTRIBUTES": "team.id=payments,cohort=pilot"
  }
}
The OTEL_RESOURCE_ATTRIBUTES variable attaches your own attributes to every metric and event. The cohort attribute separates the pilot group from the rest of the company. The documentation lists eight metrics:
| Metric | What it counts |
|---|---|
| claude_code.session.count | Sessions started |
| claude_code.lines_of_code.count | Lines of code modified, added and removed |
| claude_code.pull_request.count | Pull requests Claude Code created |
| claude_code.commit.count | Commits Claude Code created |
| claude_code.cost.usage | Session cost in USD |
| claude_code.token.usage | Tokens by type and model |
| claude_code.code_edit_tool.decision | Accepted and rejected file edits |
| claude_code.active_time.total | Active time, excluding idle time |
Events add detail, for example claude_code.user_prompt, claude_code.tool_result and claude_code.api_request. Prompt content is redacted by default. Before anyone turns it on, agree with security what should reach the collector. The documentation calls the cost metrics approximations. In the readout I therefore take cost from billing.
Companies on a Team or Enterprise plan also get an analytics dashboard in claude.ai, open to Admins and Owners. It shows daily active users, sessions and the suggestion accept rate. Once a GitHub admin installs the Claude GitHub app, contribution metrics in public beta compare merged pull requests with and without Claude Code assistance. Anthropic calls them deliberately conservative, meaning an underestimate. An organization with Zero Data Retention sees usage metrics only. On Enterprise, the Enterprise Analytics API returns daily per-user data. The Team plan has no such API. Organizations on the Claude API have their own dashboard in the Claude Console and pull daily per-user data through the Claude Code Analytics API.
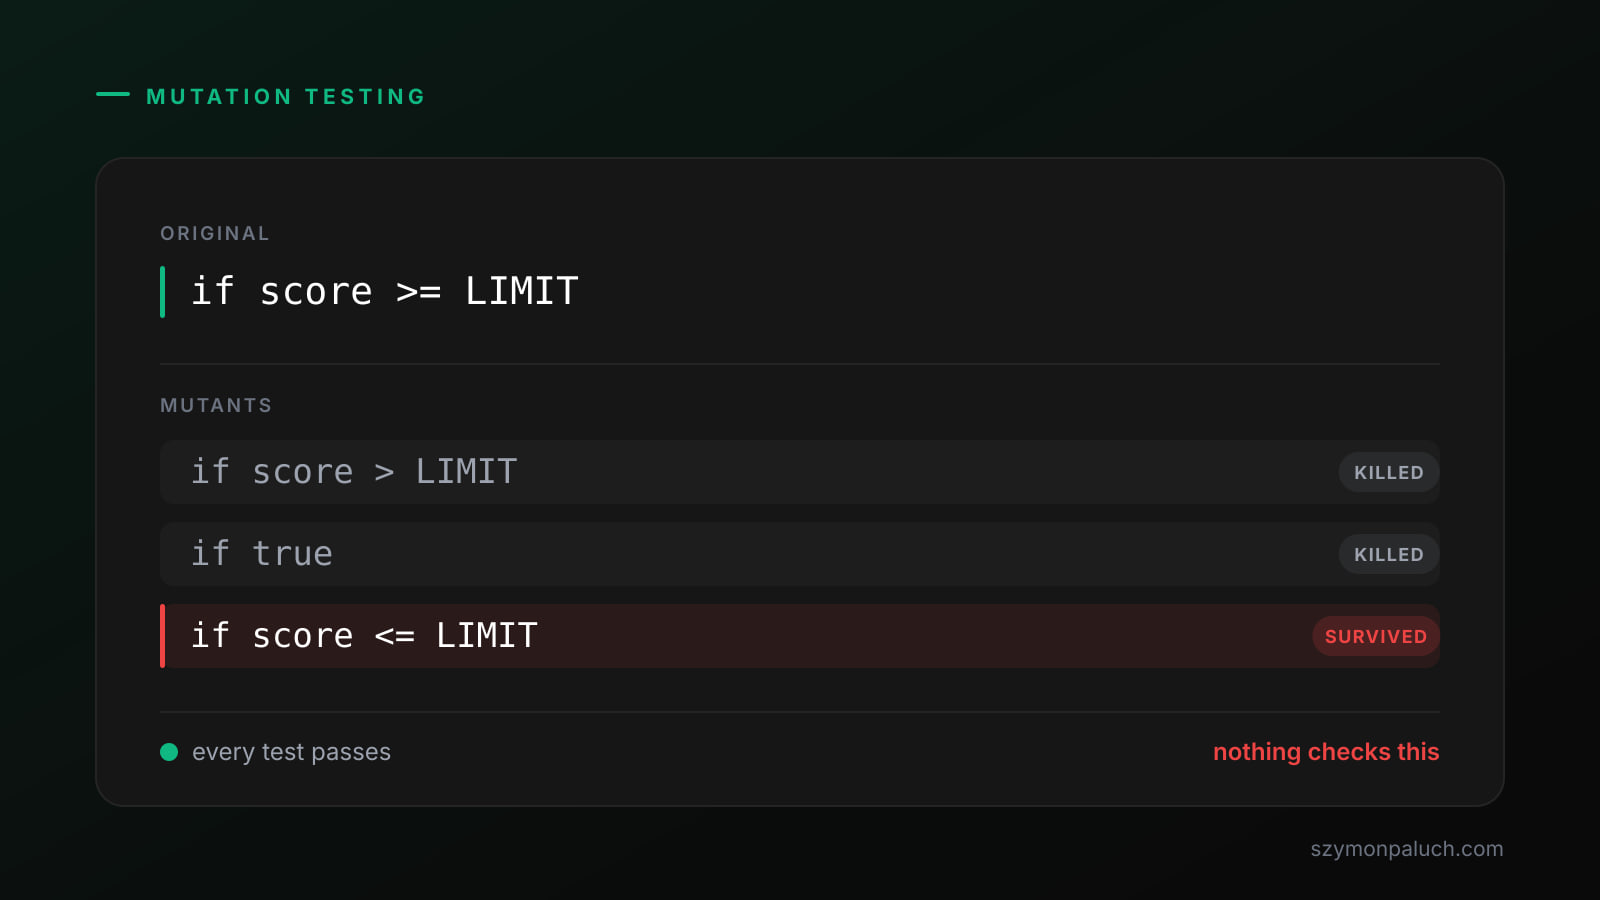
Lines of code and commits measure activity. They say little about value. An agent can add a lot of code and tests that pass without checking anything. That is why I keep the baseline metrics next to the telemetry. When an agent writes the tests, use mutation testing to check whether the new tests catch deliberately planted bugs.
This is what I do hands-on: advising on AI strategy and building agents that survive the demo.
The day-30 readout and who has to hear it
After a month I put the result on one page. It has four parts:
- • Delivery: I compare the same metrics on the same people as in the baseline window.
- • Cost: I take the amount from billing and divide it by the number of active developers.
- • Adoption: I show active users, sessions and the share of accepted edits.
- • Team: I send the same survey a second time and add three quotes and a list of blockers.
The executive sponsor has to attend the readout. They decide on the budget and on the next teams. Without them the readout turns into a status review, and the decision slips by weeks. I also invite the tech lead, someone from security and the future champion.
The readout ends with one of three decisions: scale, extend or stop. I write down the conditions for each before the pilot starts. An extension makes sense only with a named question that the extra weeks will answer. This step matches the gate after the pilot in five stages that each end with a go or no-go decision.
A hypothetical example, in round numbers. In the baseline window the median time from opening a PR to merging it is two days. Before the start we set a threshold. We scale if the median drops by at least 20% and the change fail rate does not rise. With a smaller drop we extend by a month and look at reviews. With no drop we stop.
The Agentic Architect
Practical patterns, case studies, agentic projects taken apart and AI news. Zero spam, once a week.
You'll get one email to confirm. Unsubscribe with one click. Privacy policy
A clean close: the client's team takes over the configuration
A close is clean when the client's team can change the configuration without me. I hand over three things. A versioned configuration pack. A named person who maintains it. A short runbook.
The pack is a Claude Code plugin. I keep it in a marketplace repository that the client's team controls. A plugin can contain skills, commands, agents, hooks and MCP servers. The version field in plugin.json keeps users on that version until you change it. A marketplace entry can also point at a specific commit through the sha field.
I pin MCP server versions inside the plugin itself. The command that launches a server gets an exact package version instead of the latest. The plugin dependencies documentation describes the same risk for plugins that depend on other plugins. Without a version constraint, a dependency moves to each new release. If that release renames an MCP tool your plugin calls, your plugin breaks for everyone who updates. Such a dependency can carry a version range, for example ~2.1.0. Managed settings with the extraKnownMarketplaces and enabledPlugins keys install the marketplace and the plugin on every machine.
The CLAUDE.md files stay in the repositories. The documentation advises keeping each one under 200 lines. Claude reads CLAUDE.md as context, so it does not enforce those rules. Prohibitions therefore go into managed settings, for example permissions.deny, or into a PreToolUse hook.
The champion is a person on the client's team, named in the runbook. They update CLAUDE.md when Claude repeats a mistake, when a review catches missing knowledge about the code, or when a new person needs the same context. They also release new plugin versions. I set the same condition before a workshop, because without an owner of the result, the repository from the training dies in the second week.
The runbook fits on two pages. It says how to release a new plugin version and who approves a new MCP server. It says where telemetry goes and how to roll a change back.
The test of a close comes after I leave. The champion ships version 1.1 of the plugin without the consultant, and nothing breaks.
If you want to run this cycle with outside help, the description of how I work on AI rollouts inside a client's team covers the engagement models and how they are billed.
Before the team gets its first licence, do three things. Send the survey. Write the metric definitions from the table into one document. Put the day-30 readout in the sponsor's calendar.
Frequently asked questions
How long should the baseline window be before a Claude Code pilot?
In my method, at least as long as the pilot. For a 30-day pilot that means four to six weeks of history from Git, CI and the ticketing system. Send the team survey before the first licence, because a survey cannot be run backwards.
What metrics does Claude Code export through OpenTelemetry?
Eight: session count, lines of code modified, pull requests and commits created by Claude Code, cost, tokens, file edit decisions and active time. Their names start with claude_code, for example claude_code.session.count.
Who should attend the readout after a 30-day pilot?
The executive sponsor, because they decide on budget and scale. Add the tech lead, someone from security and the champion who will take over the configuration.
Who can see the Claude Code analytics dashboard?
On Team and Enterprise plans, Admins and Owners see it in claude.ai. Contribution metrics also need the Claude GitHub app and are not available with Zero Data Retention. Organizations on the Claude API have a separate dashboard in the Claude Console, open to roles with the UsageView permission.
Can a repository turn on Claude Code telemetry?
No. Claude Code ignores the OpenTelemetry exporter variables in a repository's .claude/settings.json and .claude/settings.local.json. Turn telemetry on in managed settings, or have each developer set it in their shell or ~/.claude/settings.json.
SOURCES
- Claude Code: Monitoring (OpenTelemetry)
- Claude Code: Track team usage with analytics
- Claude Platform: Claude Code Analytics API
- Claude Platform: Analytics APIs
- Claude Code: Manage costs effectively
- Claude Code: Deploy managed settings
- Claude Code: Manage plugins for your organization
- Claude Code: Plugin manifest reference
- Claude Code: Plugin dependencies
- Claude Code: How Claude remembers your project (CLAUDE.md)
- DORA: software delivery performance metrics
- METR: Measuring the Impact of Early-2025 AI on Experienced Open-Source Developer Productivity (10 Jul 2025)
- METR: We are Changing our Developer Productivity Experiment Design (24 Feb 2026)
- METR: Measuring the Self-Reported Impact of Early-2026 AI on Technical Worker Productivity (11 May 2026)